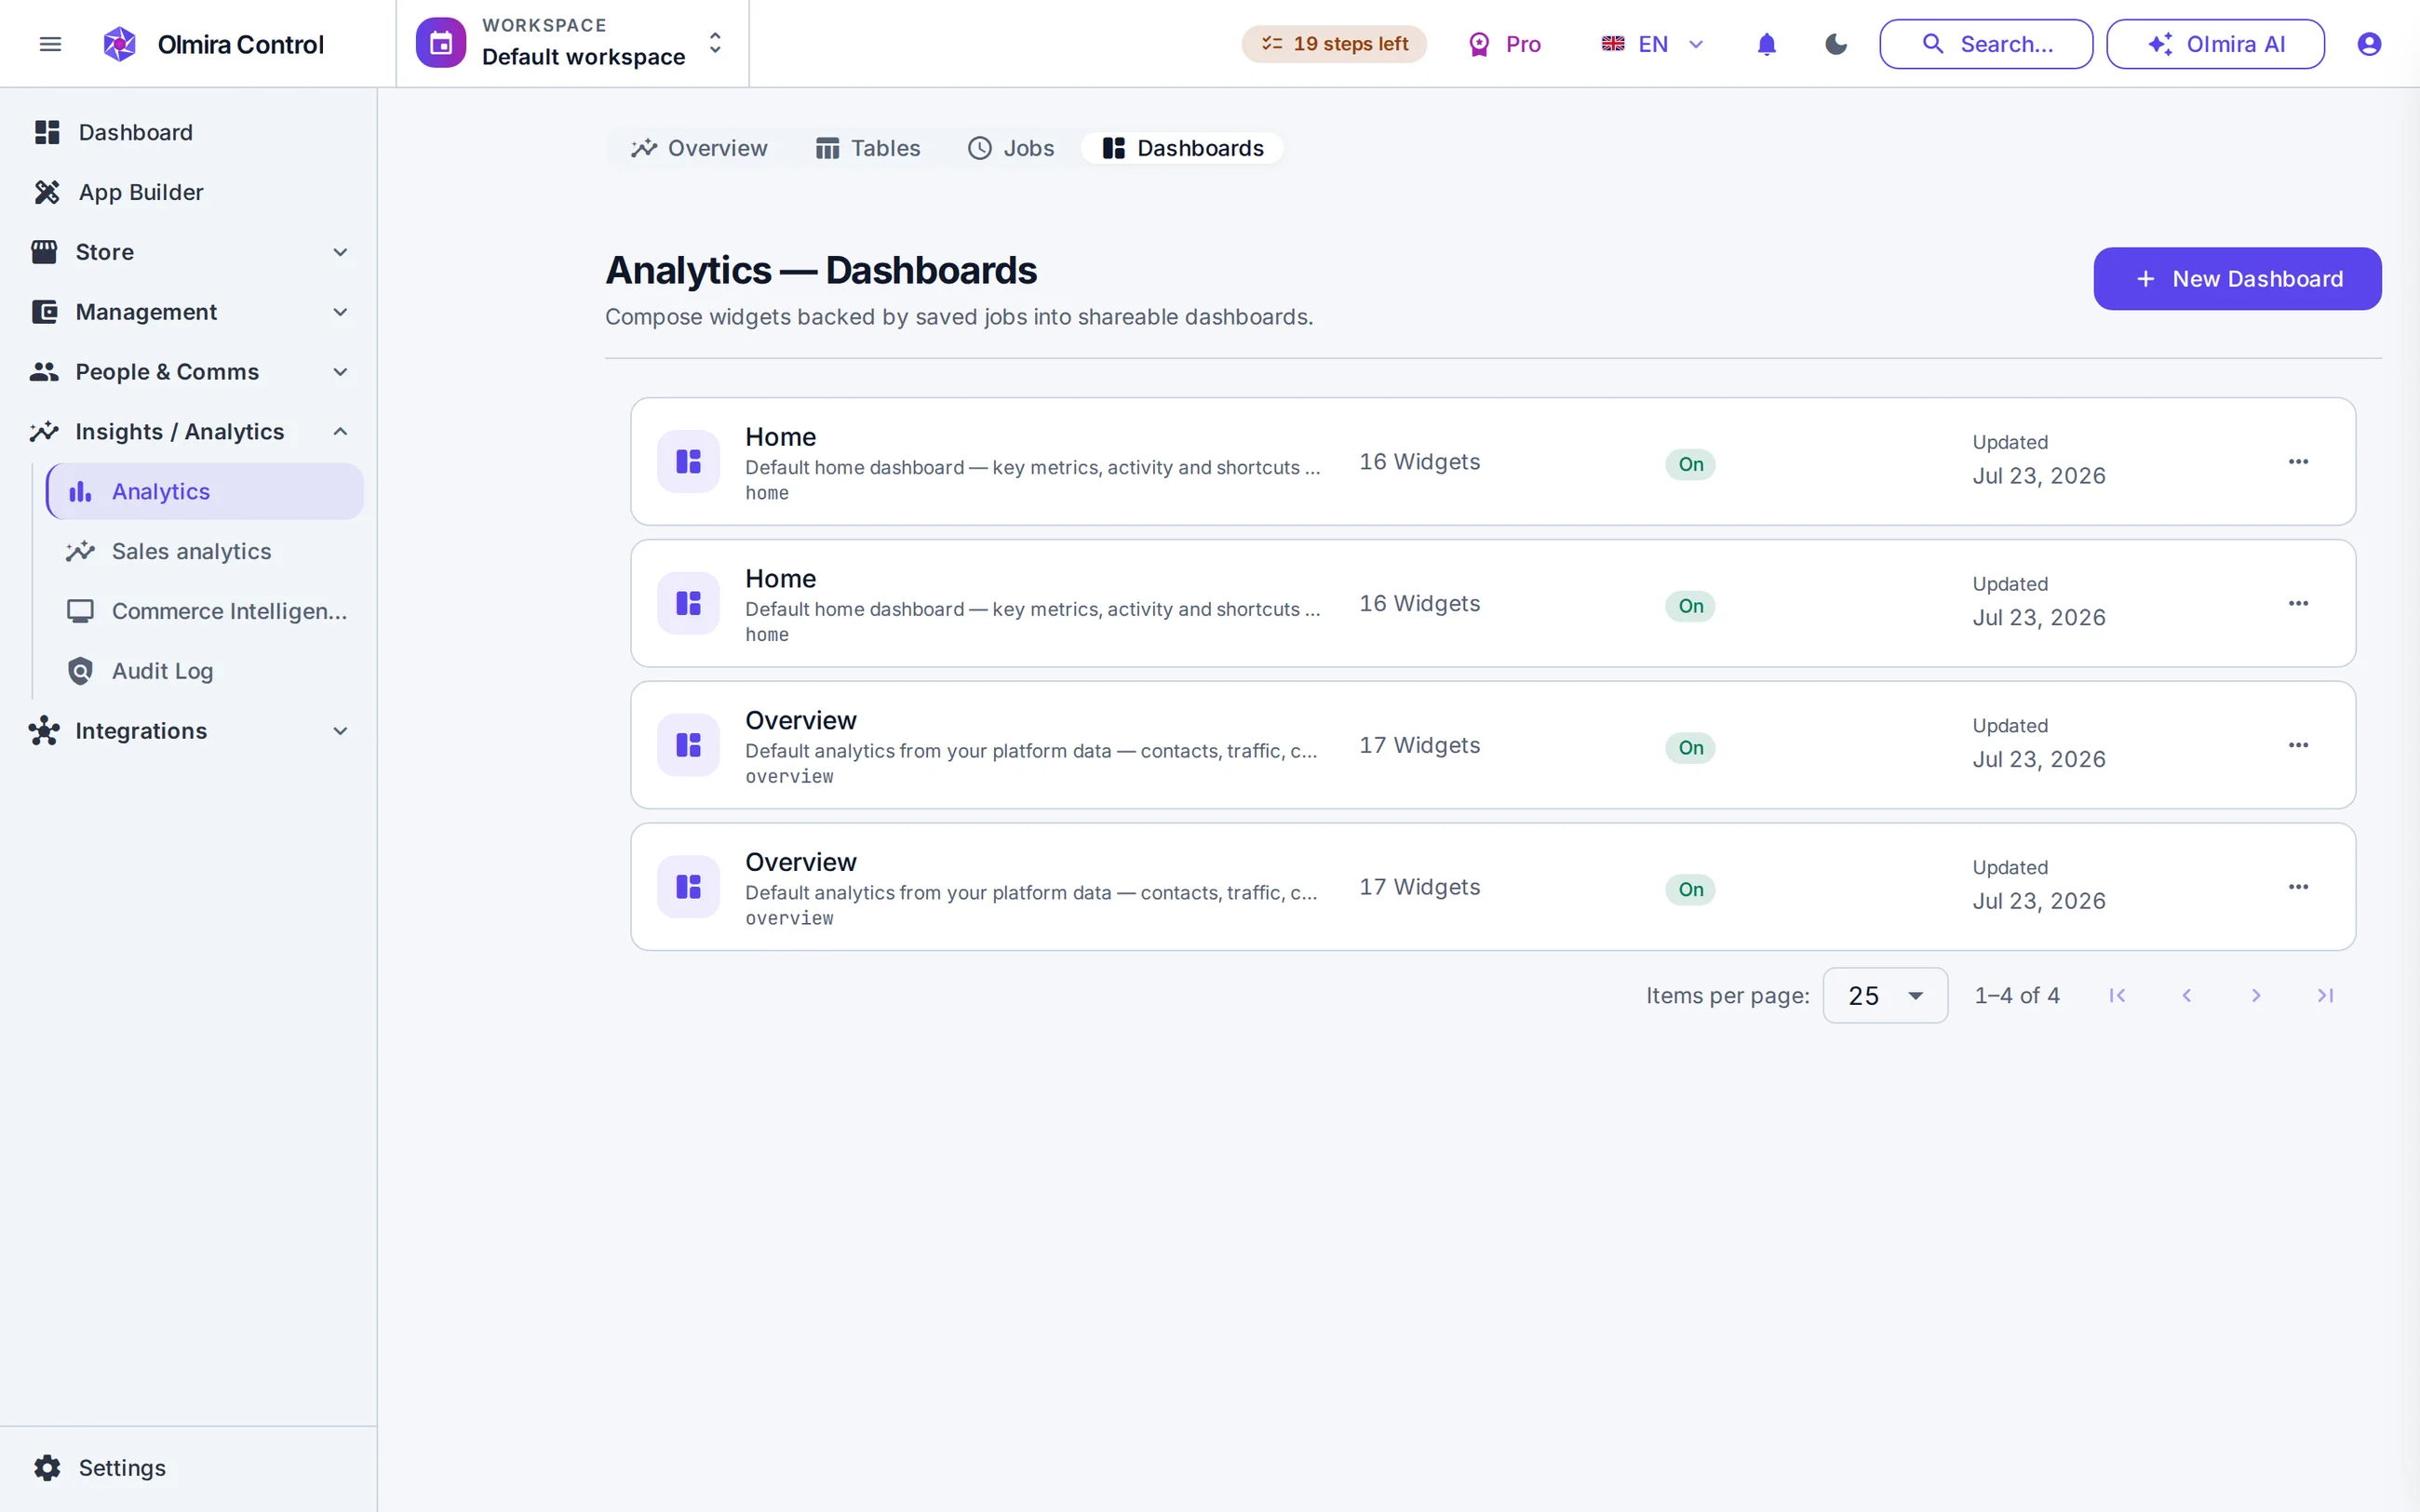
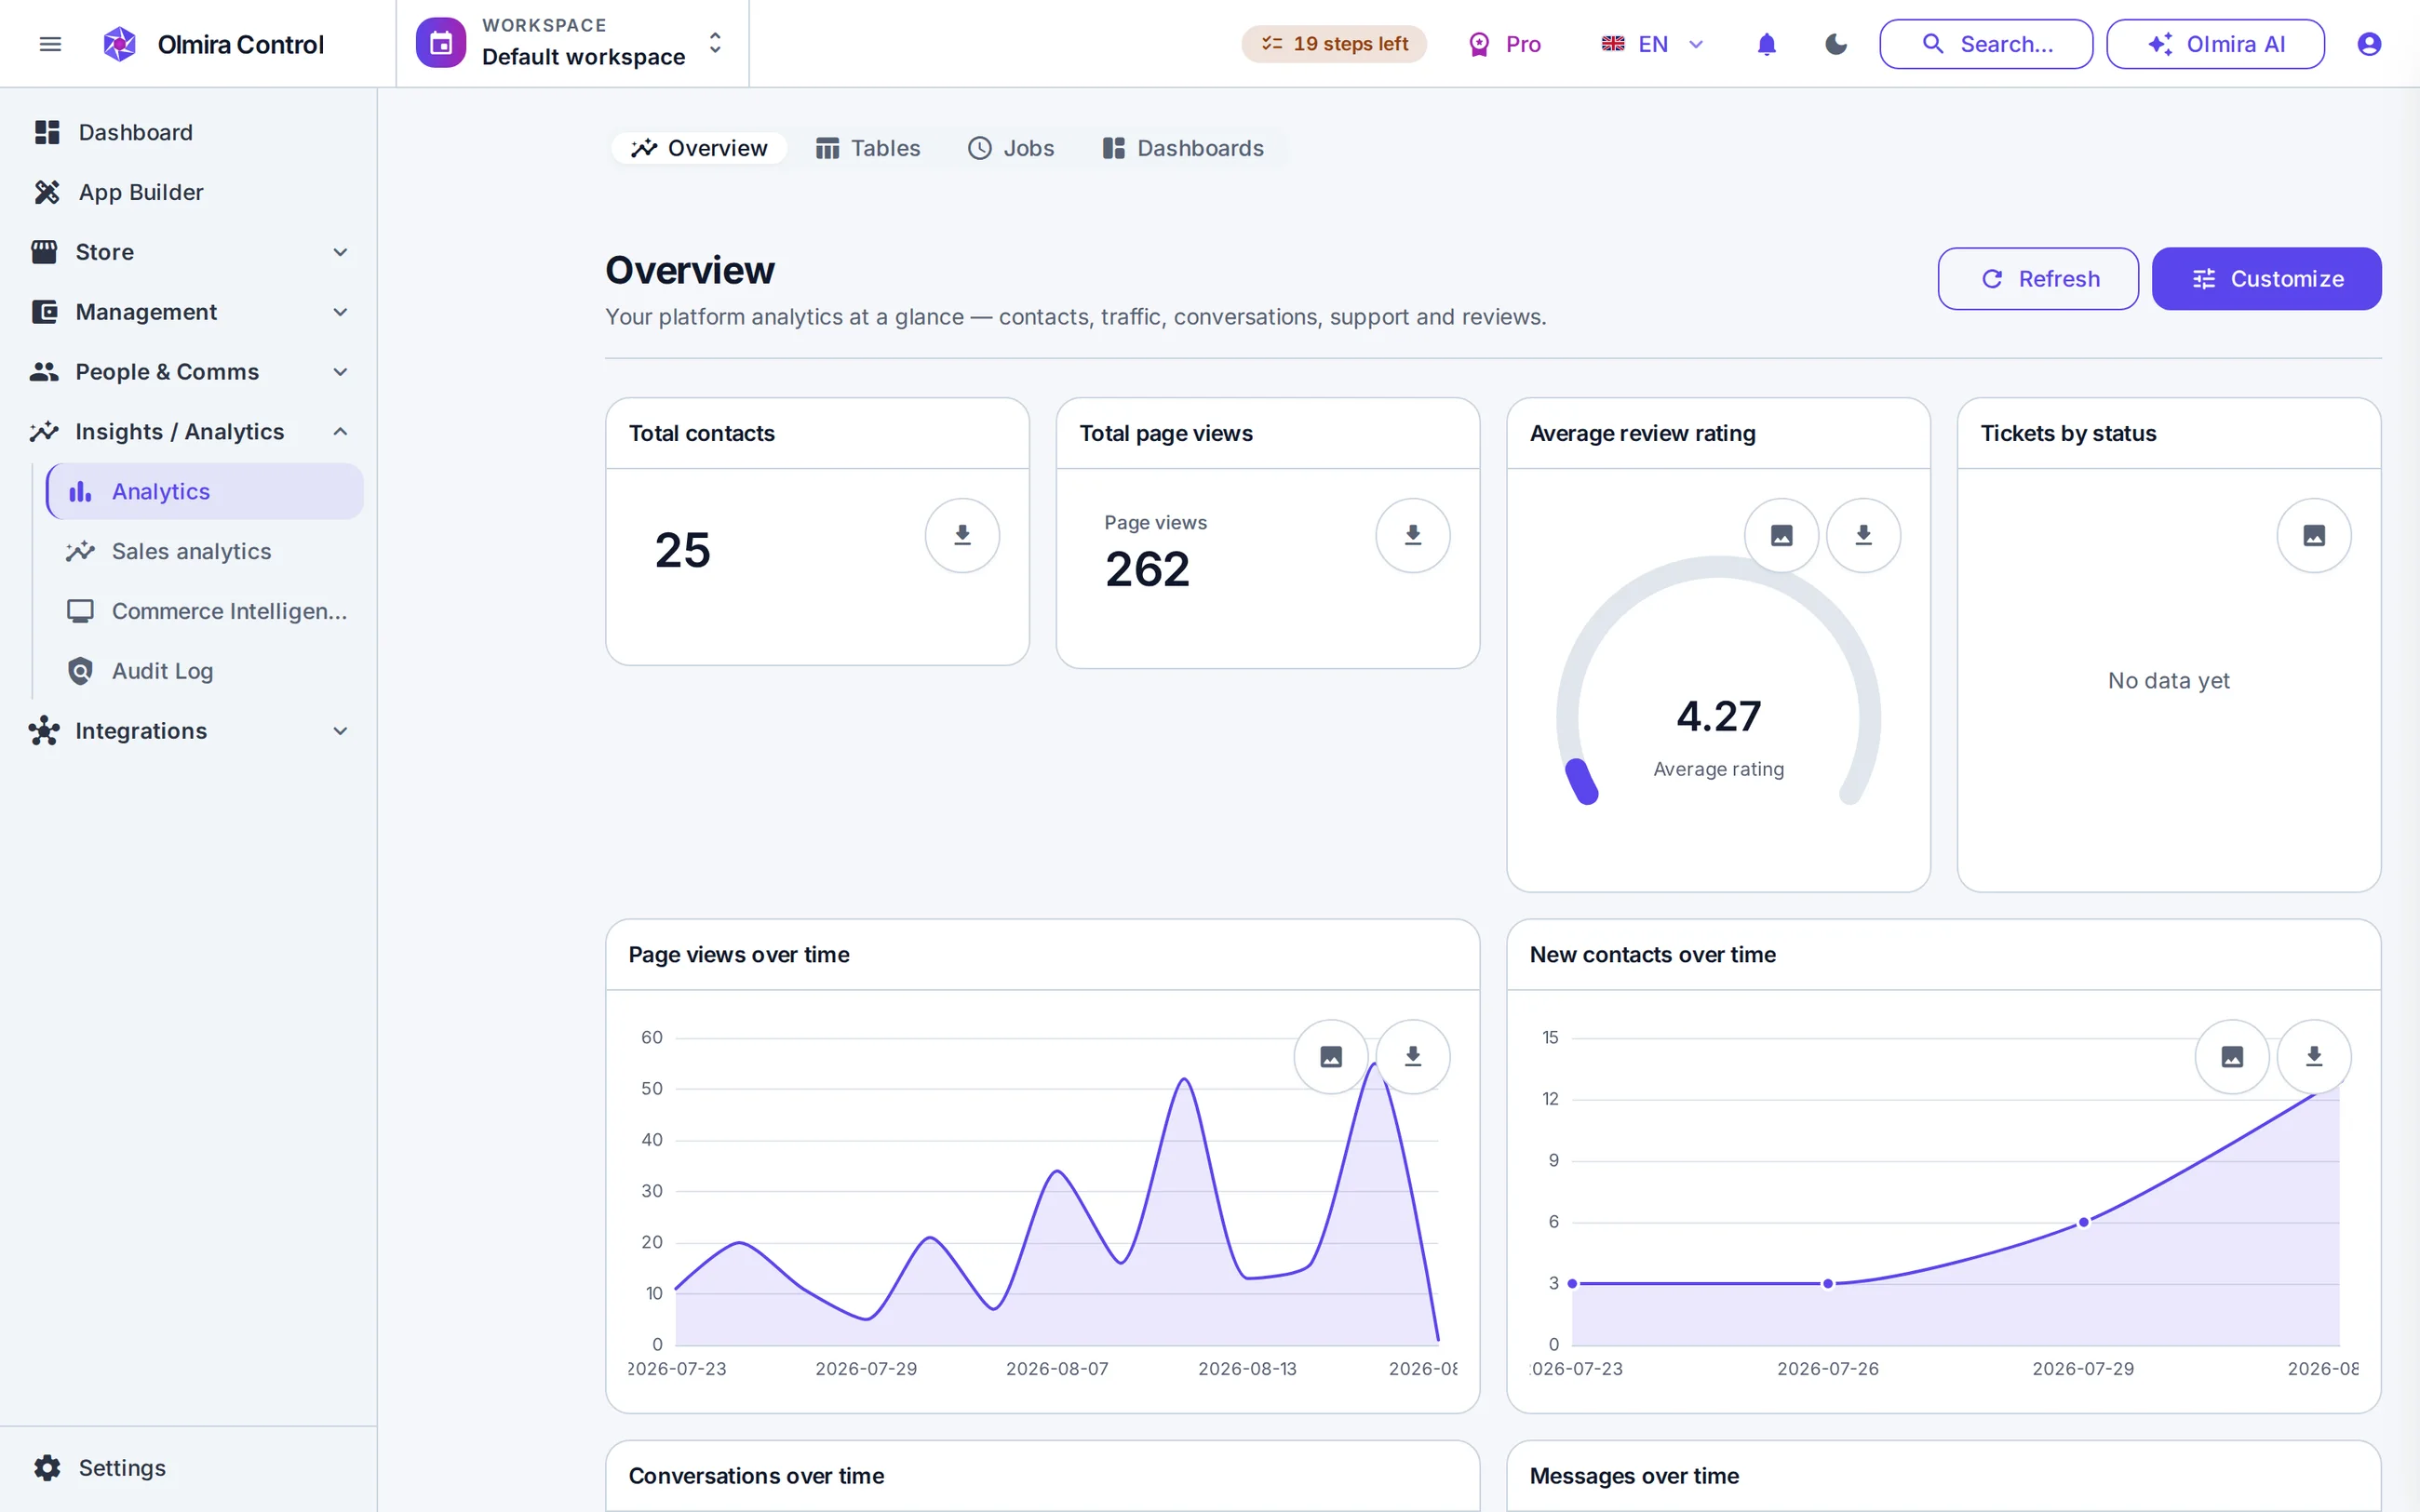
A dashboard builder, not a fixed report
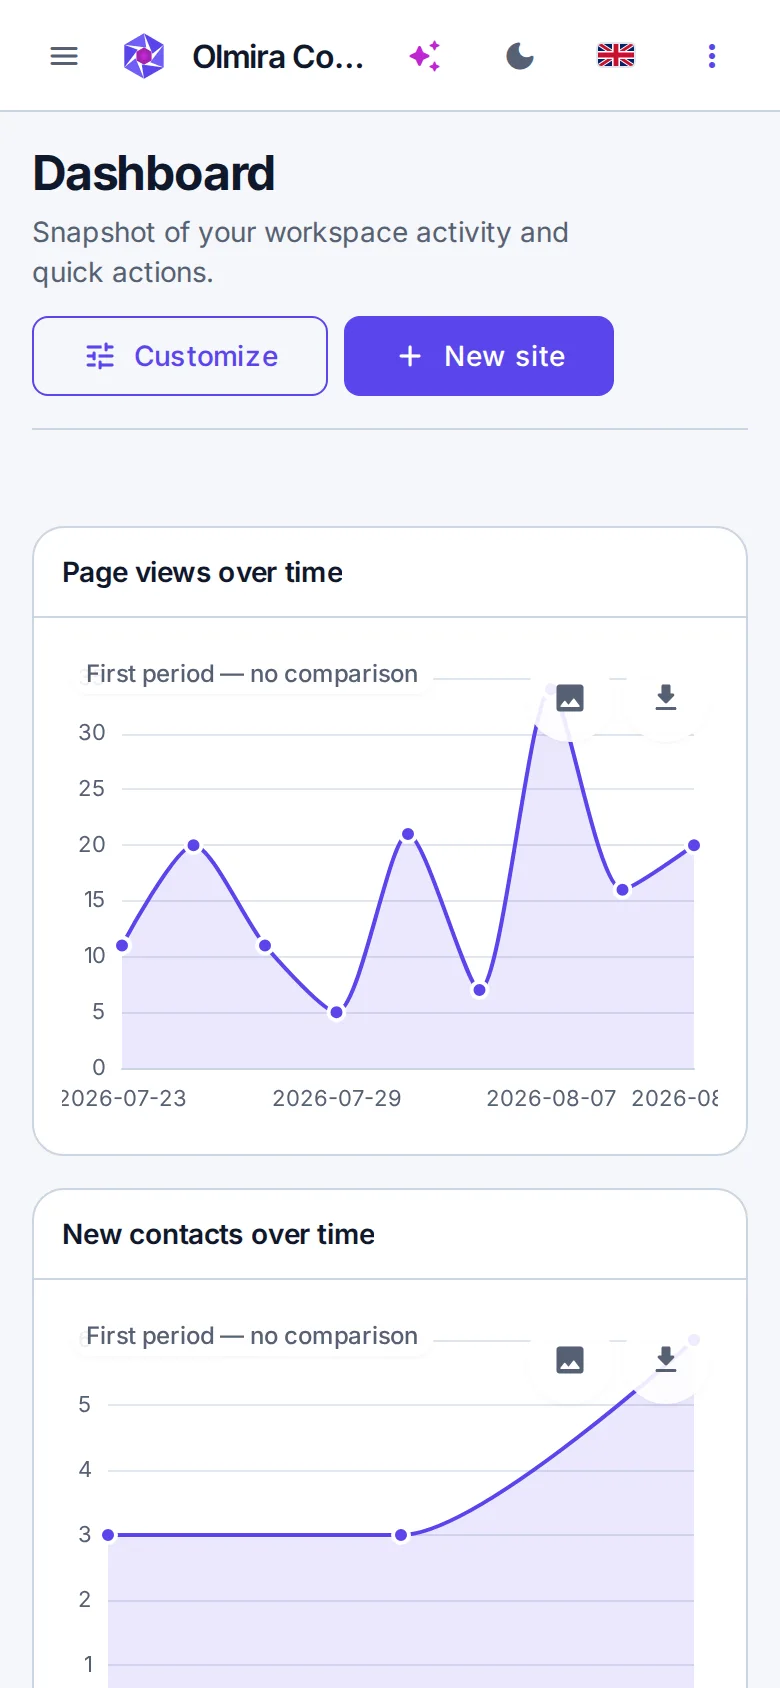
Add a widget, point it at a ready-made metric — page views, new contacts, orders, bookings, reviews, live sessions and more — and choose how it renders: line, bar, area, pie, KPI tile, table, heatmap, live counter or event feed. Set the time range per widget, and turn on period-over-period comparison to see this month against last at a glance. Any widget exports to CSV or PNG when someone asks for the raw numbers.
Which plan shows what
The dashboard builder itself is never locked — what the paid tiers add is sharing and the commerce layer.
| Capability | Free trial | Starter€19/mo | Pro and above |
|---|---|---|---|
| Dashboard builder — 50 widgets, 15 chart types | |||
| Composed Overview dashboard and page views | |||
| Public share links | |||
| Commerce analytics — GMV, margin, cohorts |
- Dashboard builder — 50 widgets, 15 chart types
- Composed Overview dashboard and page views
- Public share links
- Commerce analytics — GMV, margin, cohorts
- Dashboard builder — 50 widgets, 15 chart types
- Composed Overview dashboard and page views
- Public share links
+€10/mo - Commerce analytics — GMV, margin, cohorts
- Dashboard builder — 50 widgets, 15 chart types
- Composed Overview dashboard and page views
- Public share links
- Commerce analytics — GMV, margin, cohorts
Included Not included Add-on
Commerce analytics needs the online store as well as the Advanced analytics capability, so it starts at Pro.
Send the dashboard to your accountant — no login
A share link serves a read-only copy of your dashboard at a clean URL, frozen to the period you chose when you created it — the numbers you discussed are the numbers they see. Links are signed, expire after 30 days, and can be revoked at any time. No viewer account, no extra seat, nothing to install. It is the difference between "I'll export it and email you a screenshot" and "here, look".
Commerce numbers that reconcile
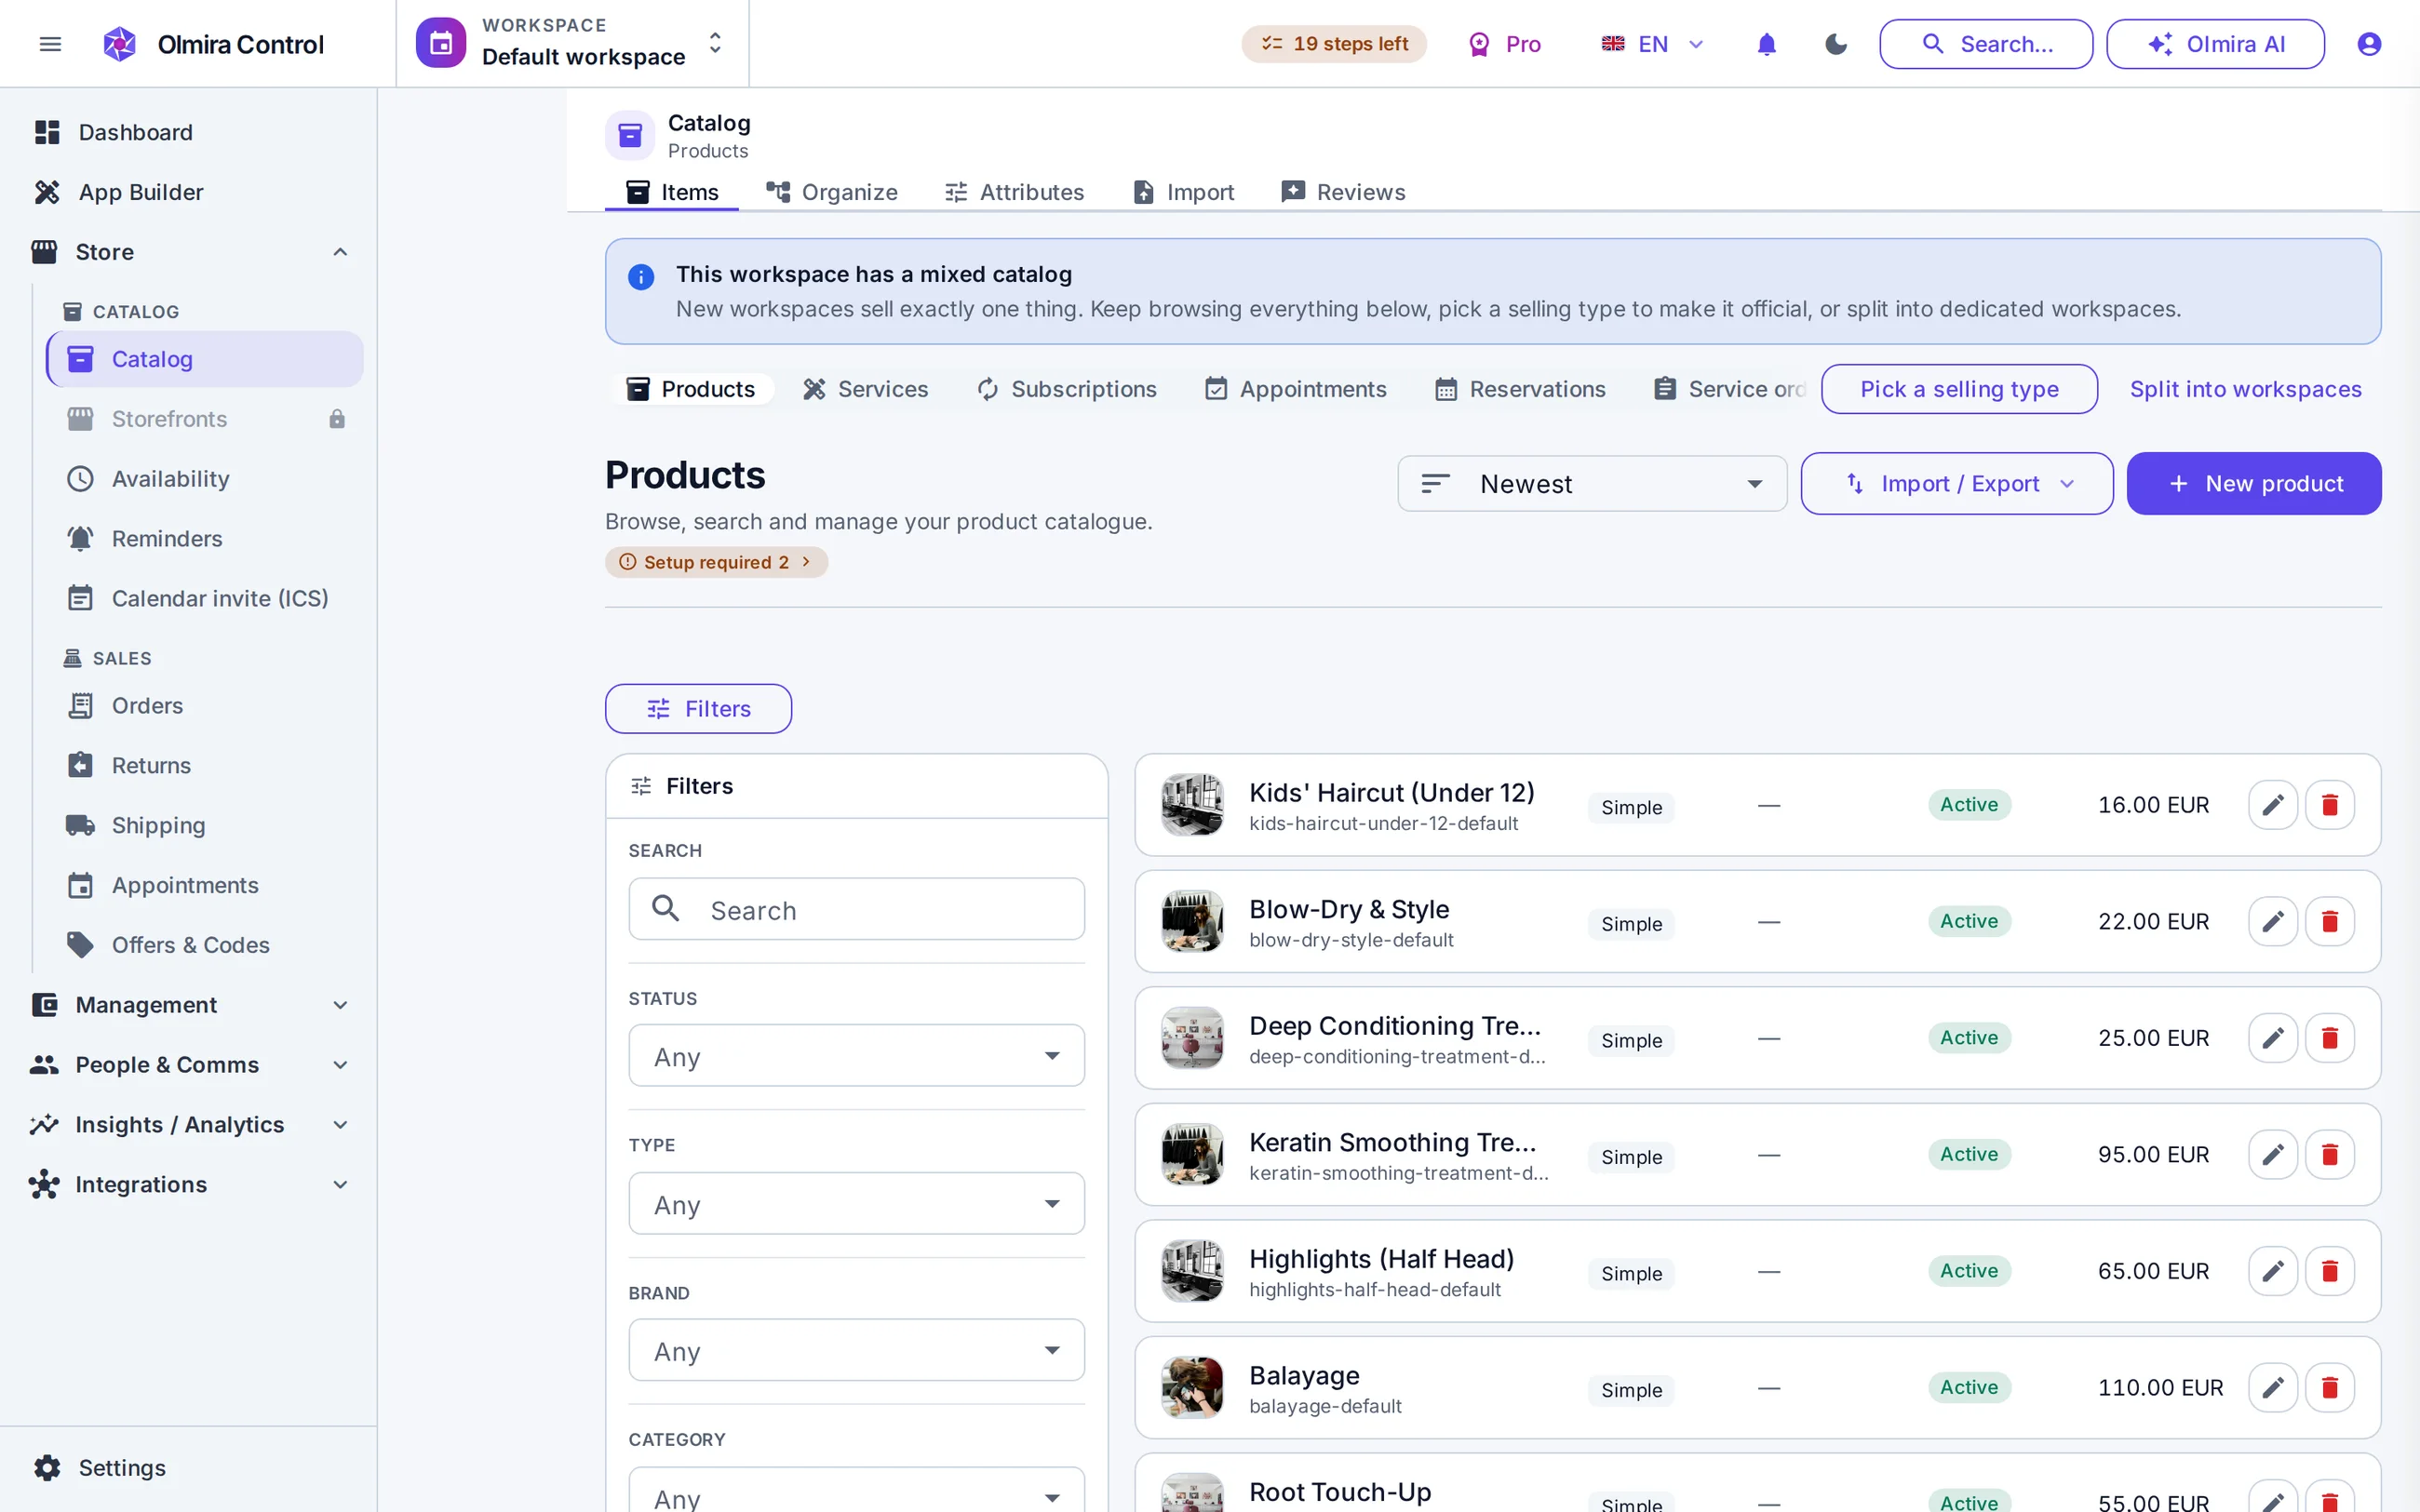
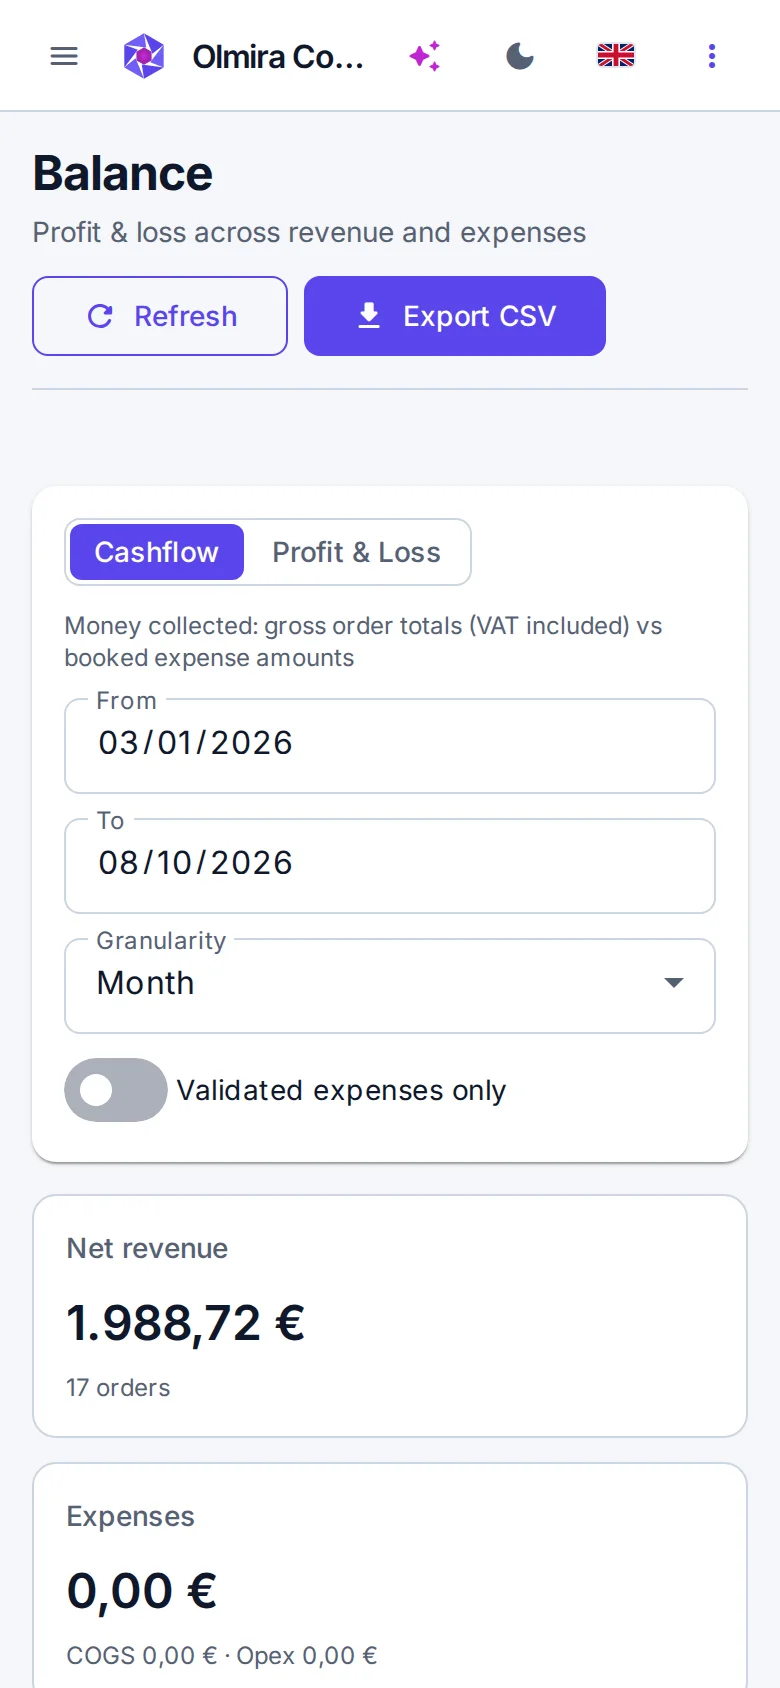
The store gets purpose-built reporting straight off the order ledger: gross merchandise value, average order value, cart conversion, and cohort retention that shows how many of March's first-time customers came back in April. Margin ranks products and categories by what they earn after cost of goods, using the cost recorded at the moment of each sale — later price edits never rewrite history. Sell in more than one currency? Totals stay per-currency by default, and the combined view tells you plainly when an exchange rate was missing rather than quietly under-reporting. Storefront subscriptions add monthly recurring revenue and churn.
A head start on day one
Check the numbers from anywhere
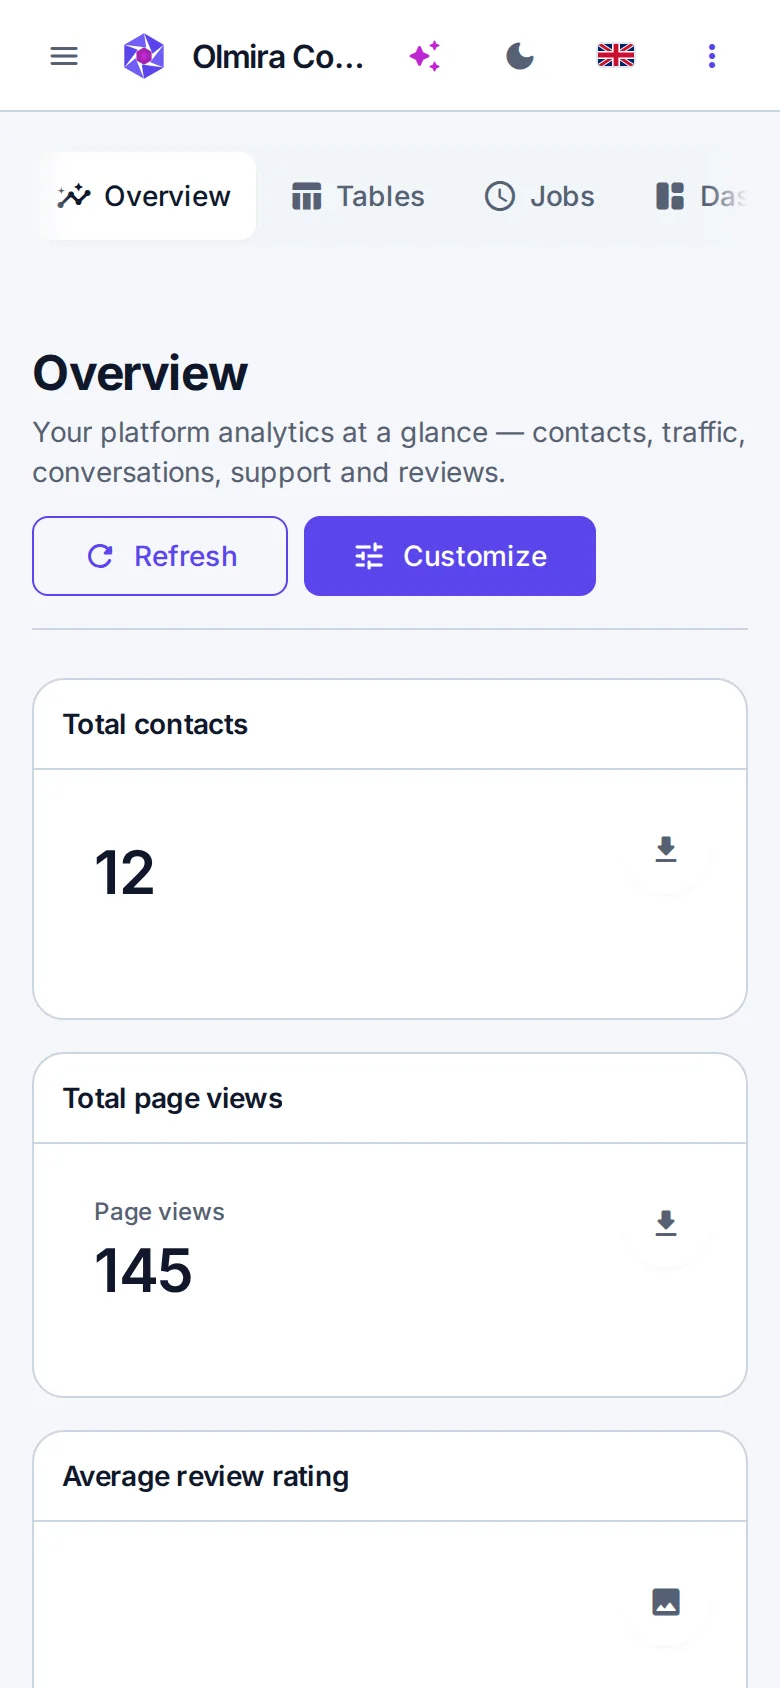
Olmira Control is built phone-first, so the same dashboards read cleanly on the train as on your desk.
Yes. A share link renders the dashboard read-only in any browser — no login, no viewer seat. Links are signed, expire after 30 days, and you can revoke any of them early.
Yes. On Pro and above, Commerce Intelligence lets you save a margin or product-contribution report, give it a schedule and an address, and the result is emailed to you on that schedule — as a summary in the message body, not a PDF attachment. Dashboards themselves aren't emailed: export any widget to CSV or PNG, or share the live dashboard by link so the other person sees current numbers rather than last Tuesday's attachment.
Directly from your orders and carts — the same records your store runs on — so analytics never disagrees with your order list. Margin uses the product cost recorded at the moment each order was placed.
Building your own dashboards is on every plan, including the trial — there is no tier where the builder is locked. Share links are included on Pro, Pro+ and Business, and cost €10/month on Starter. Commerce analytics needs the online store on top of that, so it starts at Pro.
Not silently. Reports are per-currency by default. The combined view converts through your base currency and explicitly lists anything it could not convert — a missing exchange rate is flagged, never hidden inside a wrong total.
Dashboards read live data with a short cache measured in seconds, and realtime widgets — active sessions, latest events — update as visitors act.